
2020s Remarkable Value Rally
Posted by Peter Essele, CFA®, CAIA, CFP, Jan 26, 2021
As we turn the page on 2020 (thankfully!), market practitioners are starting to release outlook pieces and portfolio positioning recommendations for the year ahead. The recent strong performance of value, when compared with growth, has many investors wondering whether it makes sense to consider an overweight to this seemingly forgotten asset class, which has benefited greatly from the recent vaccine rally.
As of the end of December, value outperformed growth by roughly 5 percent over the prior three months, according to a comparison of the Russell 3000 Value and Russell 3000 Growth indices. The final quarter of 2020 turned out to be one of the best 90-day stretches of performance for value relative to growth since the great financial crisis. Investors have taken note, particularly in the small value space, where ETFs experienced their largest four-week stretch of inflows in 10 years, according to Morningstar.
Where Does Value Stand Today?
To help answer that question, let’s quickly revisit a point I made in a prior post, where I highlighted the fact that the value premium has been mostly nonexistent over the last 30 years. Growth, I showed, had clearly won out, with the reasoning why presented in the follow-up post.
Of late, however, value has undoubtedly performed well. Even so, I’m not convinced this trend represents the great rotation back to value that many have expected. Instead, what we’ve seen is a strong move up for value-oriented industries that were hit hard in 2020s pandemic-induced downturn, notably automobiles, airlines, and energy services. (The three industries are up 34.8 percent, 28 percent, and 47.3 percent, respectively, in the last three months.) Naturally, with the emergence of a vaccine and light at the end of the tunnel for a return to a normal economy, these areas have roared back to pre-COVID levels. The move has been so swift that the Russell 1000 Value P/E ratio is now at a multidecade high, as evidenced in the chart below.
The strong performance of value in 2020 has investors wondering whether to overweight this asset class. Commonwealth’s Peter Essele examines the data.
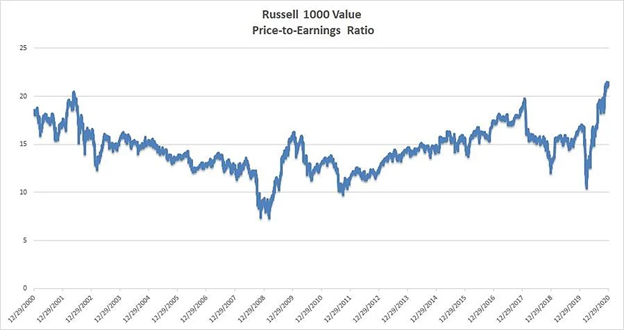
Source: FactSet
Where Will Value Go from Here?
In Commonwealth’s view, continued strength in value is predicated on the financial sector doing well in 2021, as this area represents the largest component of the Russell 1000 Value Index. A handful of major banks currently trading at reasonable valuations could potentially carry the torch forward. Without their strong performance, however, it’s hard to see how the value rally could persist—or how the asset class will continue to outperform growth.
For financials to do well, we’d most likely need to see a steepening of the yield curve—a situation where long-term Treasury rates offer yields markedly higher than those of short-term rates. In that environment, banks could lend money at higher long-term yields (30-year mortgage rates) and pay depositors at short-term yields (savings account rates), effectively netting the difference as profit. Currently, long-term Treasury rates are historically low compared with short-term rates. But if the economy continues along its current trajectory, there’s a very real possibility that long-term rates will move higher. That would create a positive outcome for financials in the near term.
Over the long term, however, it’s hard to envision a sustainable value rally led by financials on a 3- to 5-year basis. Certainly, we might see a 6- to 12-month extension of the current trend, but longer-term outperformance of value seems unlikely. Value has experienced a strong move off the bottom and received strong inflows, resulting in lofty valuations for many sectors and industries. That scenario just doesn’t bode well for an asset class with lackluster prospects for relative growth.
What Are the Implications for Investors?
Currently, both the value and growth asset classes are trading above average valuations. The big question for investors is, will the risk-reward scenario favor growth-oriented investments beyond a 12-month horizon? To answer this, each investor must consider his or her particular situation and goals. For the foreseeable future, however, it may be reasonable to consider overweighting growth relative to value.
© 2021 Commonwealth Financial Network®
© The Axial Company. All Rights reserved. 5 Burlington Woods, Suite 102 Burlington, Massachusetts
Disclosure: Certain sections of this commentary contain forward-looking statements based on our reasonable expectations, estimates, projections, and assumptions. Forward-looking statements are not guarantees of future performance and involve certain risks and uncertainties, which are difficult to predict. Past performance is not indicative of future results. Diversification does not assure a profit or protect against loss in declining markets. All indices are unmanaged and investors cannot invest directly into an index. The Dow Jones Industrial Average is a price-weighted average of 30 actively traded blue-chip stocks. The S&P 500 Index is a broad-based measurement of changes in stock market conditions based on the average performance of 500 widely held common stocks. The Nasdaq Composite Index measures the performance of all issues listed in the Nasdaq Stock Market, except for rights, warrants, units, and convertible debentures. The MSCI EAFE Index is a float-adjusted market capitalization index designed to measure developed market equity performance, excluding the U.S. and Canada. The MSCI Emerging Markets Index is a market capitalization-weighted index composed of companies representative of the market structure of 26 emerging market countries in Europe, Latin America, and the Pacific Basin. It excludes closed markets and those shares in otherwise free markets that are not purchasable by foreigners. The Bloomberg Barclays Aggregate Bond Index is an unmanaged market value-weighted index representing securities that are SEC-registered, taxable, and dollar-denominated. It covers the U.S. investment-grade fixed-rate bond market, with index components for a combination of the Bloomberg Barclays government and corporate securities, mortgage-backed pass-through securities, and asset-backed securities. The Bloomberg Barclays U.S. Corporate High Yield Index covers the USD-denominated, non-investment-grade, fixed-rate, taxable corporate bond market. Securities are classified as high-yield if the middle rating of Moody’s, Fitch, and S&P is Ba1/BB+/BB+ or below.