
For all the hype around today’s inflation data and what it might mean for markets and the economy, the truth is simply this: not much news here.
Breaking Down the Numbers
Looking at the numbers, this conclusion becomes clear. Headline inflation, which includes energy and food, jumped from –0.1 percent to 0.5 percent on a monthly basis, as energy prices ticked back up. Here, the annual figure dropped slightly, from 6.5 percent to 6.4 percent. The core number, which excludes energy and food, ticked up from 0.3 percent to 0.4 percent on a monthly basis, but it dropped from 5.7 percent to 5.6 percent on an annual basis. In both cases, we saw monthly volatility, but the annual trend downward continued—which is what we have seen for the past several months.
The core numbers are better indicators of what is going on with the real economy, as energy prices can and do bounce around. So, let’s take a closer look there.
A Closer Look at the Core Data
This month’s core data was in line with expectations and remains at the lower end of the range we have seen since 2022. On a three-month average basis, core inflation is running at around 4 percent per year. This is, of course, not at the Fed’s 2 percent target, but it is still well below where we are now on an annual basis. The annual trend will continue down unless the monthly numbers spike back up.
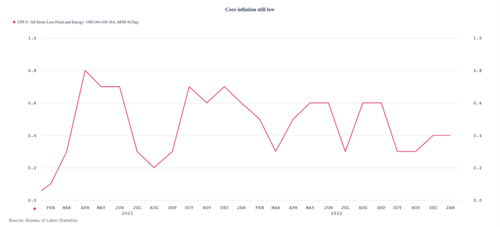
When we look at the details of the monthly reports, that spike looks unlikely. The swing this month is largely coming from goods, which were in deflation last month and swung to positive. This is something to watch. But with core goods at only 0.1 percent, now that the effects of the swing are accounted for, the future damage should be contained.
Downward Trend Likely to Continue
On top of that, in general, most of the remaining inflation is coming from the service sector, and most of that from shelter. The housing market has softened dramatically, and that component should be declining over the next several months. Other services (hotels up, medical care down, airfares down) are mixed. With non-shelter services inflation low and with shelter likely to roll over, the trend should keep going down.
Not Great, But Reassuring
The short version of this is that we did see inflation rise on a monthly basis. But that was simply a result of typical volatility in the data, and the trend remains unchanged. Lots to talk about, if you’re into that, but no real changes in the overall situation. This isn’t a great report, but it is a reassuring one in that the existing favorable trend continues overall.
Keep calm and carry on.
Authored by Brad McMillan, CFA®, CAIA, MAI, managing principal, chief investment officer, at Commonwealth Financial Network®.
© Axial Financial Group. All Rights reserved. 5 Burlington Woods, Suite 102 Burlington, Massachusetts
Disclosures: Certain sections of this commentary contain forward-looking statements that are based on our reasonable expectations, estimates, projections, and assumptions. Forward-looking statements are not guarantees of future performance and involve certain risks and uncertainties, which are difficult to predict. All indices are unmanaged and are not available for direct investment by the public. Past performance is not indicative of future results. The S&P 500 is based on the average performance of the 500 industrial stocks monitored by Standard & Poor’s. The Nasdaq Composite Index measures the performance of all issues listed in the Nasdaq Stock Market, except for rights, warrants, units, and convertible debentures. The Dow Jones Industrial Average is computed by summing the prices of the stocks of 30 large companies and then dividing that total by an adjusted value, one which has been adjusted over the years to account for the effects of stock splits on the prices of the 30 companies. Dividends are reinvested to reflect the actual performance of the underlying securities. The MSCI EAFE Index is a float-adjusted market capitalization index designed to measure developed market equity performance, excluding the U.S. and Canada. The MSCI Emerging Markets Index is a market capitalization-weighted index composed of companies representative of the market structure of 26 emerging market countries in Europe, Latin America, and the Pacific Basin. The Russell 2000® Index measures the performance of the 2,000 smallest companies in the Russell 3000® Index. The Bloomberg US Aggregate Bond Index is an unmanaged market value-weighted performance benchmark for investment-grade fixed-rate debt issues, including government, corporate, asset-backed, and mortgage-backed securities with maturities of at least one year. The U.S. Treasury Index is based on the auctions of U.S. Treasury bills, or on the U.S. Treasury’s daily yield curve. The Bloomberg US Mortgage Backed Securities (MBS) Index is an unmanaged market value-weighted index of 15- and 30-year fixed-rate securities backed by mortgage pools of the Government National Mortgage Association (GNMA), Federal National Mortgage Association (Fannie Mae), and the Federal Home Loan Mortgage Corporation (FHLMC), and balloon mortgages with fixed-rate coupons. The Bloomberg US Municipal Index includes investment-grade, tax-exempt, and fixed-rate bonds with long-term maturities (greater than 2 years) selected from issues larger than $50 million. Basis points (bps) is a common unit of measure for interest rates and other percentages in finance. One basis point is equal to 1/100th of 1 percent, or 0.01 percent.